Every organization faces risks, and they want to reduce it as much as possible. Unfortunately, it is cost-prohibitive to eliminate it completely. And honestly, I don’t think it is possible to get rid of it all. Risk is inherent in everything. What’s important is deciding how much risk you are willing to accept and the amount you are going to spend to reduce it.
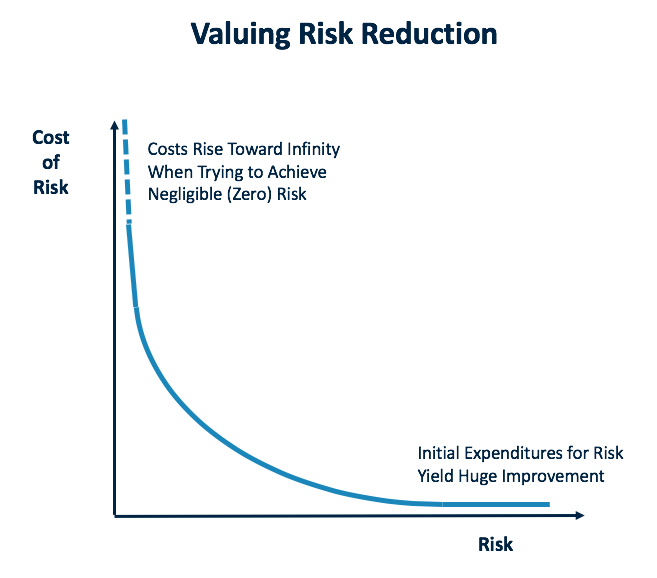
Initial investments addressing risk typically yield significant gains, but as one tries to achieve zero risk, the costs are nearly infinite. Companies want to be somewhere in the middle of this curve.
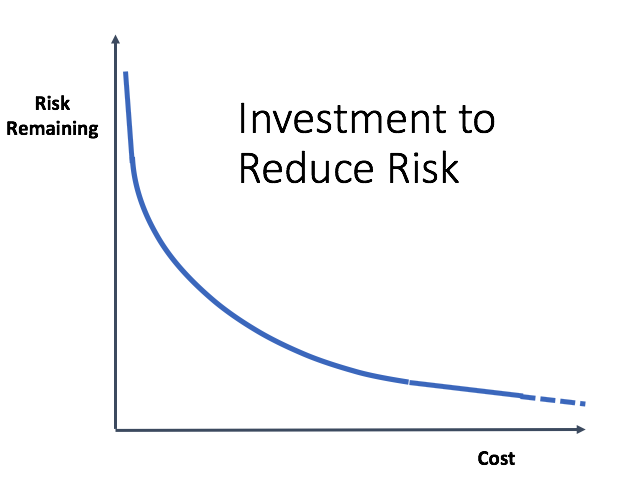
Another way to look at this is to reverse the axes. As the risk goes toward zero, the cost rises higher and higher. Look at the amount of risk and how much money you have to reduce it. Either way, one starts with high risk, and the more money spent, the lower the risk goes, but it becomes very expensive. In Curtailing Bureaucratic Growth, I discuss this concept more and include three anecdotes to illustrate the extremes of driving risk to zero.
The Space Shuttle Challenger Accident
When I talk to people about the 1986 Challenger accident, they get upset because NASA knew of the risk of ice forming on the O-rings. How could they move forward knowing this risk existed? I view it the opposite way. If there is an accident, I think it’s a bigger condemnation of NASA if we didn’t know of the risk beforehand. I say “we” because I used to work there. I mean if we didn’t understand our systems well enough and a problem came up that we were unaware of, I think that would be very negative.
When we flew space shuttles, hundreds maybe thousands of risks existed that were non-zero for losing the system. The job was figuring out the probability that the risk would manifest itself. We can’t drive it to zero. It might be one in a million, but it must have some value. I say that when an accident happens, you hope it was one of the things you thought of before. Then, you go back and assess it. Was the likelihood of it happening really understood? Are there ways to reduce the probability more? What is the possibility that it will occur again? We must think about these things.
In an airliner, they usually talk about a risk of 10-10 for any single incident, 10-9 for a single major subsystem, and 10-6 for any combination of systems that could be disastrous for an airliner. They don’t talk about making the risk zero. There is some probability that some bad things can happen, but they try to manage it in such a way that the situation is resilient under a combination of factors.
Communicating Risk to the Public
People have a difficult time talking about non-zero probability. Another example relates to the car industry. Car companies gather an enormous amount of information from accident scenes. And ultimately, it boils down to how much are they willing to spend to save a life. They cannot completely remove the risk, so companies have to run the numbers to find the appropriate tradeoffs. When court cases go to trial, it has been shown that it is hard for juries to understand the concept of limiting expenditures and accepting some risk. Their initial reaction is that car companies should be willing to spend near infinite dollars to save every life. Car companies are continually reassessing the risks, but as we know, accidents happen.
There is a famous court case called the Ford Pinto Case, where during discovery it appears that Ford computed the costs of a fix to a fatal flaw was about $200,000 per life. Ford decided this cost was too much, sparking quite a bit of discussion and analysis.
Tools for Formally Managing Risks
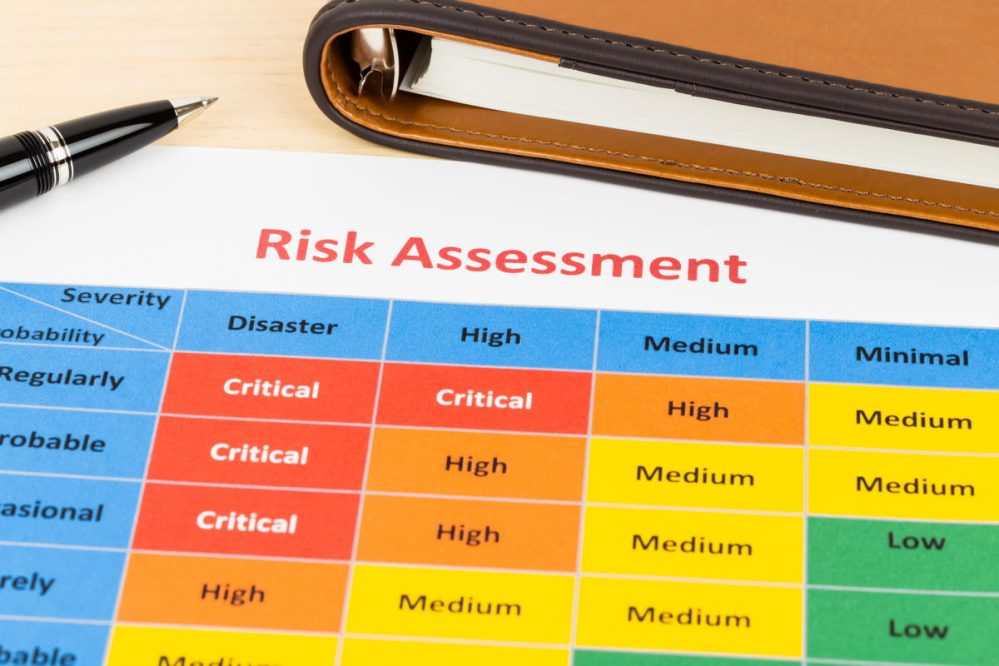
How does one make these tradeoffs? The aerospace industry, when building airplanes, rockets, and missiles, developed a process for tracking and measuring risk, and each company calls it by a different name. I have yet to find a consistent term, but people refer to the tool as risk matrices, risk cubes, or risk heat maps. The goal is to try to understand all the risks, visualize them, and objectively manage them.
One axis represents the probability of the event happening, and the other is for the consequences if the event occurs. In this image, the hot spot – high probability and large consequences – is in the upper-right corner. Some people reverse the axes, but I prefer this version because I like the concept of visually driving the risk down.
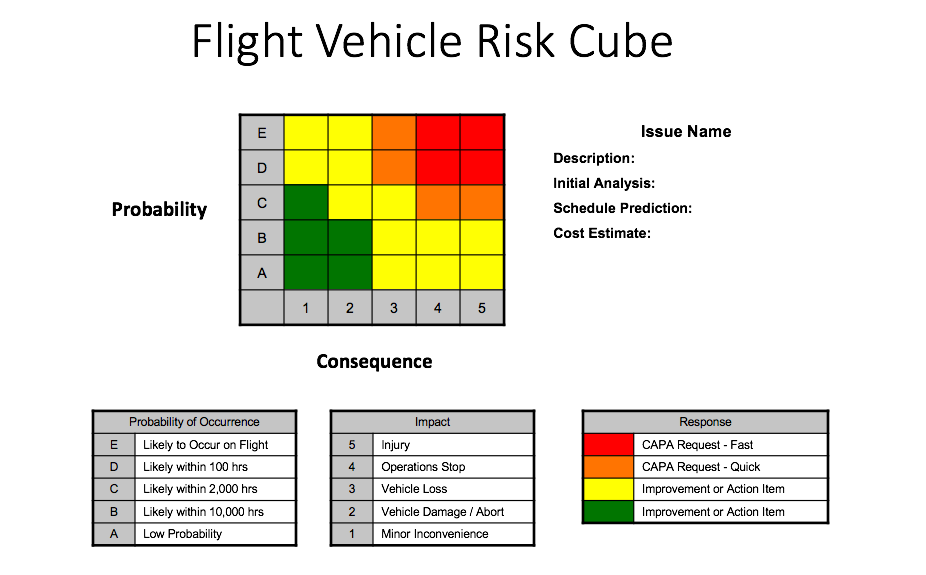
The approach is to take every item that could be a possible issue and map it. The example above is for a flight vehicle on a drone project and only deals with one problem. By looking at the legends for the matrix, you see that E5 – likely to occur on a flight, resulting in injury – is a bad place to be. The response for this is a fast CAPA (corrective action / preventative action) request. Red and orange items require corrective action in order to drive them to yellow or green. Yellow and green items can always improve, so identify those, but they may not require attention. For every issue, companies must decide where on the graph they want it. How much risk are they willing to accept based on the data?
Some things might happen on a flight like a dropped communication signal for a few seconds. This is fairly likely to occur, so the design must assure that it is only a minor inconvenience. If something is expected to happen, one doesn’t want to be in a situation where a dropped communication link for a second means losing the vehicle. This requires a CAPA request.
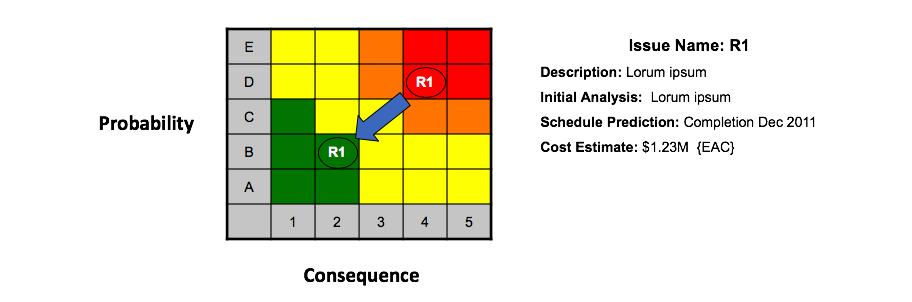
Once a CAPA request is made, the item is investigated, which results in a description of the issue and an initial analysis that includes a possible timeline, cost estimate, and an engineering action change (EAC). In this example, the corrective action lowers both the probability and the consequences.
While heat maps can contain only one item, most companies choose to map multiple items to assess the various issues.
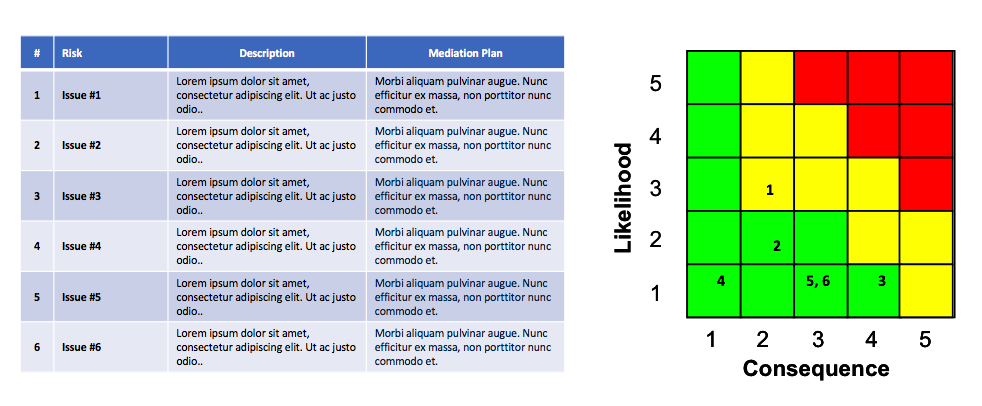
It’s easy to see how useful this tool is for evaluating risks. Some of the benefits are that it is easy to see the status of current risks, and it creates a culture of finding and reporting risks. Everyone is trying to populate these maps with everything they can find, so don’t shoot the messenger. It’s vital to your organization to have a handle on all the potential risks to make informed and objective decisions. Work as a team to allocate the budget to drive the risk down and to the left, toward green.
What typically happens with program management meetings is everyone comes together periodically, maybe once a week or month. They map all the items and come up with CAPAs and goals for where they think the issues can get to once completing the EACs. Then, they assess the available budget for risk reduction. It’s also common to compare what the chart looked like at the last meeting and to show arrows of the movement of the issues.
While this may look analytical, it requires calibration. Some issues may report yellow, but they aren’t on track yet and are without a plan for recovery to green. Decisions must be made on how to allocate resources.
Throughout the years, I find that when you include these risks in proposals that people have more confidence in you because you’re trying to identify gaps for success and what can be done to ‘buy down’ those risks. I’m a firm believer in showing it. Others disagree and want to hide it. To me, I think understanding what your risk factors are can build trust in the person you are working with.
Adding Time
This next example comes from a university risk auditing committee assessing and mapping the top 20 risk factors and ensuring each item had a reaction plan. The axes’ labels changed to likelihood and impact, but the model is still red, orange, yellow, and green, albeit a pale green. Notice that the circle sizes vary. The larger the diameter, the faster the issue will escalate into the risk.
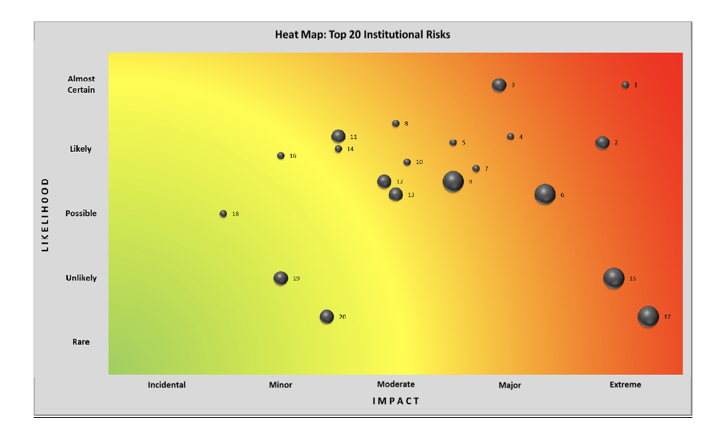
Item 1 is almost certainly going to happen and the impact will be extreme, but it won’t occur quickly. Item 17 will rarely happen, but when it does, it will be fast and have severe consequences. This approach is another way to look at risk.
Startup Risks
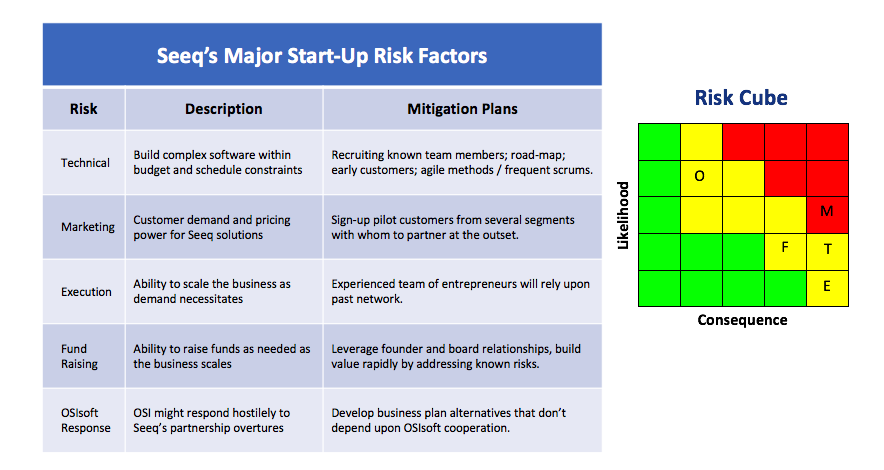
This final example comes from Seeq, a software startup I’m leading. About six months into the program, we created a list of what we thought the potential risks were in the areas of technology, marketing, execution, fundraising, and partnerships. We wanted to assess our risks and obtain funding such that we could drive our exposure to the lower-left corner.
Agile Methodologies
At Seeq, we use an agile approach – a term that comes from the software industry – to address risk. We take small steps with many experiments along the way so that we can assess the situation as it unfolds. When something works, we invest more in it and stop funding the ones that don’t work out.
The Lean methodology, which is a subculture in agile, was developed by an industrial engineer at Toyota in the 1950s. It is a business model that focuses on continuous improvement and respect for people. Stephen Blank is credited with launching the Lean Startup movement. His philosophy is that startups require different processes than larger organizations. He advises not investing heavily in startups until you’ve really reduced the risk and worked with customers to understand how to solve their problems.
Lean Canvas resulted from Lean Startup, and that is where you summarize on one page all the risks of a startup. As you talk to angels and early investors, try to put that money against the largest risks to reduce them.
Bottom Line
Managing risk is vital to running any business at every stage of the process. Using risk management tracking tools allows corporations to objectively capture and track the risks, driving them to green.

Share this Post